
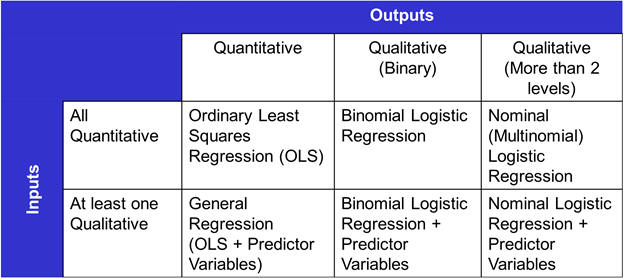
Mixed response modeling is a mouthful but a very simple concept. Outputs (responses) can be either Quantitative, Binary, or Nominal. Each of these types of outputs should be handled differently in regression. Specifically…
- Quantitative outputs are modeled with Ordinary Least Squares Regression (OLS)
- Binary outputs are modeled with Binary Logistic Regression
- Nominal outputs are modeled with Nominal Logistic Regression
Inputs have similar issues. If an input is categorical (qualitative) then it should be modeled with predictor (dummy) variables. To summarize in a table ….
For some reason, competing software has decided to make your life interesting by ….
1) Mandating that you model each output individually.
2) Testing your memory by requiring a different menu item for each type of regression.
3) In the case of Ordinary Least Squares regression, having two menu items… one for all quantitative inputs and one for a mix of quantitative and categorical. Note: some call OLS with Categorical inputs “General Linear Model” or “General Regression”.
4) Making prediction as painful as a root canal, with multi-response prediction nearly impossible. For many, the whole point of performing a DOE is to predict with the resulting transfer function. Not only is it difficult, but each type of regression has a different user interface for prediction, ensuring you spend some quality time reading the help system.
With Quantum XL we’ve simplified the modeling of categorical inputs, different types of outputs, and multiple responses. When you’re setting up the DOE, simply tag inputs as categorical by using the check box (see screen shot below). That’s it; Quantum XL will take care of the rest. When you hit the regression button, Quantum XL will handle the categorical inputs automatically.
When you define the output(s), you tag each output as either Quantitative, Binary, or Nominal. (See screen shot below.)
Quantum XL creates a new worksheet in Excel, and then it’s up to you to enter the data. Note that output Turbo Press is quantitative, Turbo Blade Damage is binomial (Yes, there is damage, or No, there isn’t), and Type Damage is nominal (heat failure, oil contamination, or none).
Once you enter the output data, you’re ready to run the regression. Select “Analyze Design” then “Run Regression”.
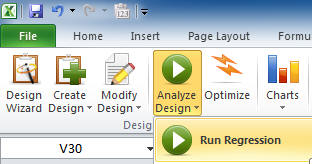
Yes, Quantum XL will run the correct type of regression automatically. Yes, Quantum XL will run all three models at the same time – no need to go back to the menu for each output. No, there are not different menu items for OLS, Binary, and Nominal. No, you don’t need to indicate that Model Year and Vendor are categorical again, and again, and again. Yes, it really is as easy as one button. You’re welcome and chocolate isn’t necessary but we’d love to be on your Christmas card list.
Prediction
To appreciate how easy prediction is, download the Excel workbook at the link below. The model is similar to the one above, but we tweaked it a bit to show off. The example below has 10 factors, 2,000 runs, and three outputs. We’ve picked this example since you can calculate a 23 full factorial on an abacus … and that would be an egregious insult to Quantum XL’s highly vectorized multi-core regression engine. Unless you spend hours of your spare time playing Crysis, you probably don’t know what that means. It means fast. Not piddly fast like a Bugatti Veyron, but fast like “man this SR-71 feels inadequate compared to Quantum XL”. Try to suppress the expletives the first time you try it.
Click here to Download the Demo Model
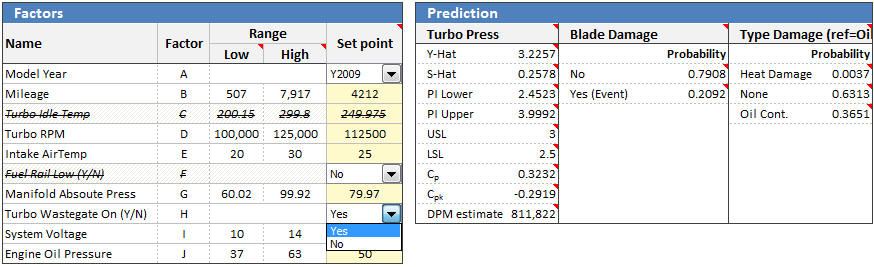
How easy is prediction? Right above the regression table is a prediction area. On the left you’ll find the factors (inputs) and on the right you’ll find the outputs. See the column “Set Point”… just type a value in the corresponding cell and watch the prediction change on the right. For example, in the screen shot below, the year is set to “Y2009”, mileage to 4212, Turbo RPM to 112500, …. You might note that the inputs “Turbo Idle RPM” and “Fuel Rail Low (Y/N)” are struck out. If you open the workbook, you’ll notice that I’ve already reduced the model. Those two inputs were removed from all of the outputs and therefore don’t do anything anymore. Yeah, we like it, too.
The outputs on the right have the current prediction. The current predicted value for Turbo Pressure is 3.225 with an estimated standard deviation of .2415. The estimate of standard deviation comes from the S-hat model. Quantum XL automatically checks for replicated values and if possible, builds an S-hat model. You’ll also notice numerous other nice-to-have statistics like PI (prediction interval), the current spec limits, Cp, Cpk, and DPM (which come from the spec limits and estimates of Y-hat and S-hat). Continuing with the binomial output “Blade Damage”, for the current inputs the model predicts a 93.43% chance of no damage. For the turbo damage (not the blade) the current inputs predict a probability of .31% of heat damage, 71.47% of no damage, and 28.22% chance of oil contamination.
Perhaps we’d like to know how the prediction would change if the input “Turbo Waste Gate On” was changed from No to Yes. No problem, just change the drop down from No to Yes (see below) and the predictions will change. Specifically, the Turbo Press didn’t change at all but the probability of blade damage increased from 6.57% to 20.92%. Looks like we should leave the waste gate off.
Yes, the prediction output changes the second you type the new values into the prediction area. No, you don’t have to restart the regression, search through numerous buttons, find an obscure box, enter the prediction points, and run the regression again. No, it isn’t different for Binary vs. Nominal regression, you just type in the set points. Yes, the categorical inputs are in a drop down box to make it easy. Fine … maybe chocolate is appropriate, we prefer dark over milk.
Optimization
Optimization is just as easy. To give you an idea of what you can do, take a look at the screen below. The optimizer is set to minimize the blade damage (output 2, binomial) while keeping the turbo pressure (output 1, quantitative) between 2.5 and 3.5, and while keeping the Type Damage (output 3, Nominal) probability of no damage greater than .99. No, this isn’t a mistake. You really can optimize across multiple outputs at the same time.
Click the “Optimize” button and a few thousands of a second later you get the results. Press the “settings to worksheet” button and the optimal inputs are conveniently copied to the “Set Points” (see below). Note that Turbo Pressure is at 3.4435 (between 2.5 and 3.5), Blade Damage has been minimized, and the Type Damage probability of “None” is greater than .99.
Right now you might be wondering if it really was this easy. Well, to be honest, you didn’t have to click many buttons, but on the down side you did have to wait several hundred thousandths of a second to get the answer.
One App To Rule them All
With the release of Quantum XL 2013, you can get general purpose statistics, Monte Carlo simulation, DOE, and companion tools (QFD, FMEA, Pugh) in one package. For more information, try out this tutorial or if you are ready to buy, head over to the purchase page.