

Quantum XL
Features
Statistical Tools, Design of Experiments, and Monte Carlo Simulation, all in one Excel Add-In. Here's what's included.
Statistical Tools

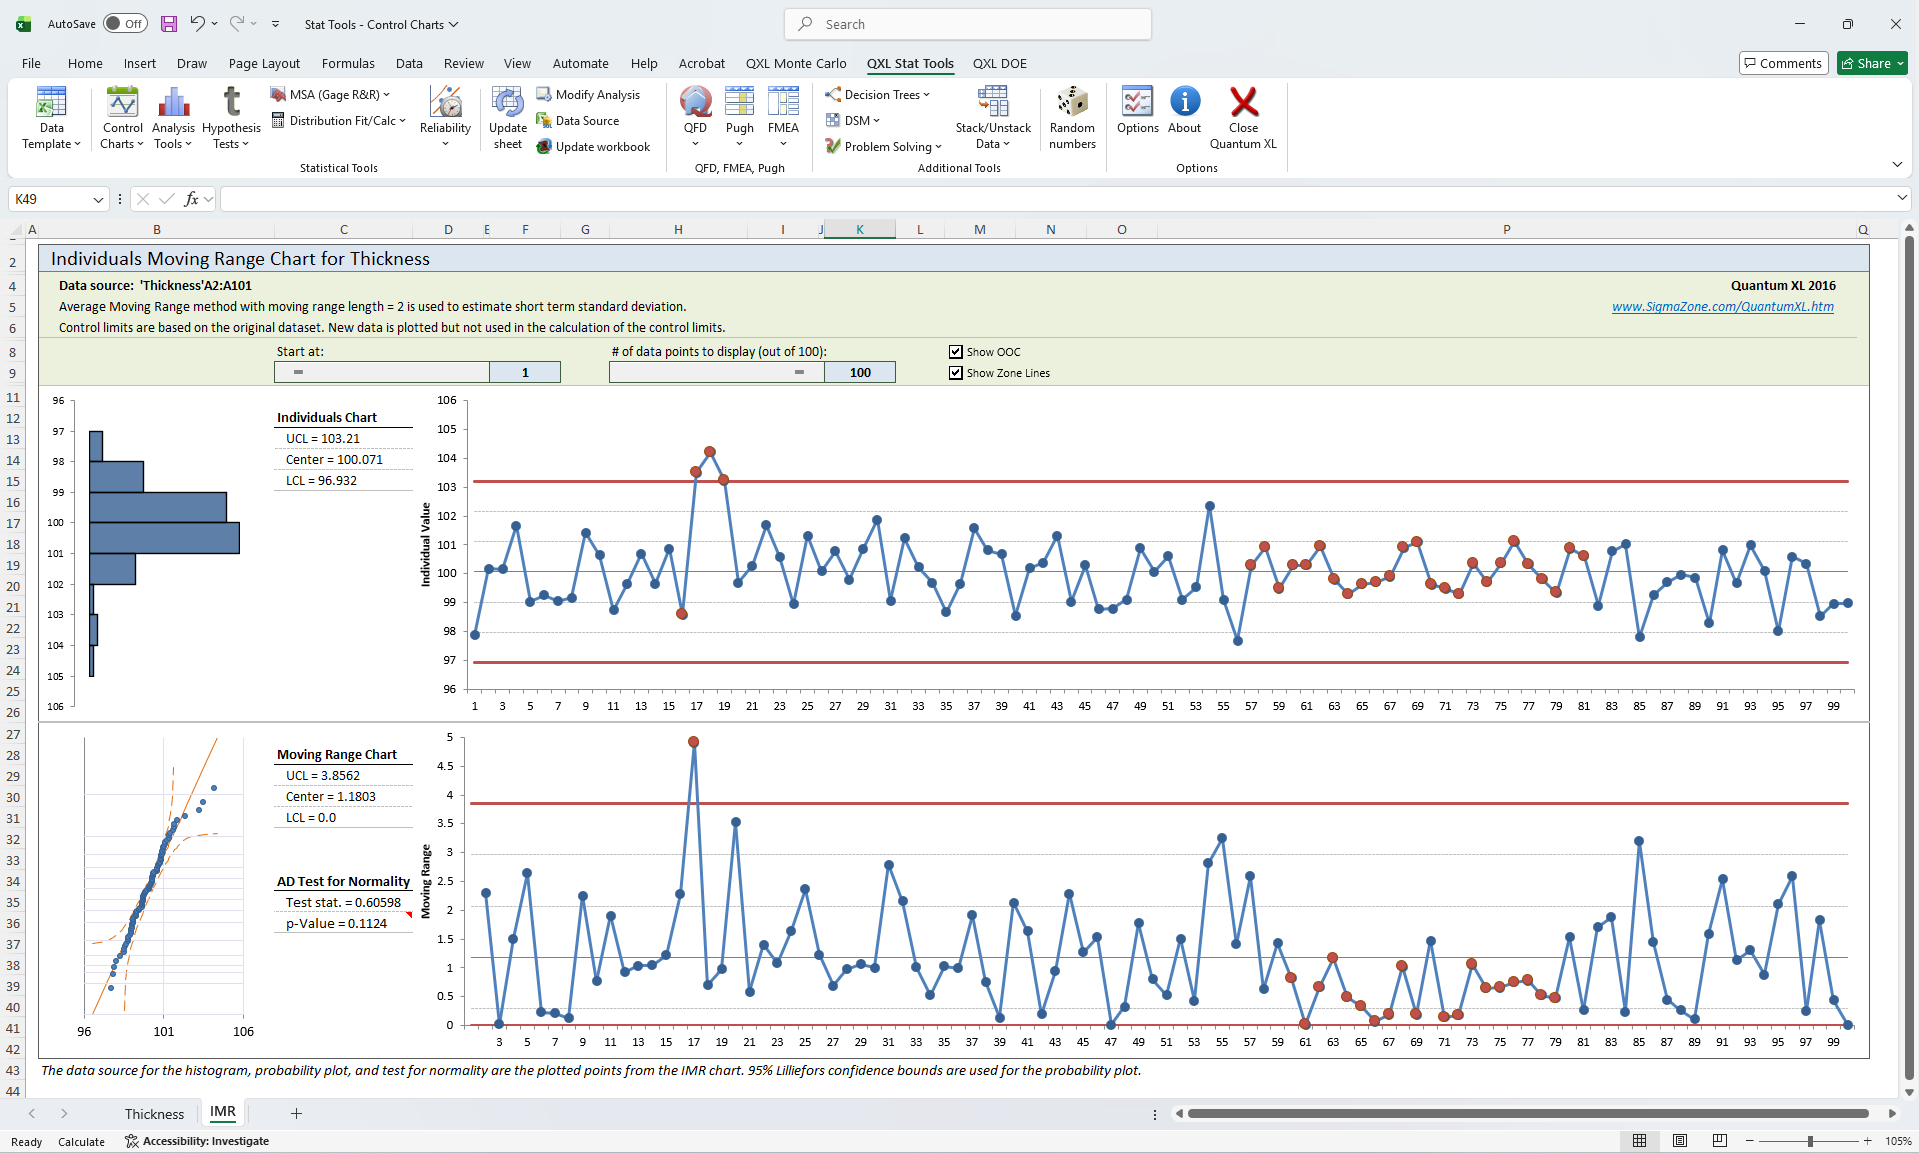
Control Charts, Capability Analysis (Cpk), Histograms, Pareto, Hypothesis Testing, Measurement System Analysis (MSA), Distribution Fitting, Reliability Modeling, Transformations, Decision Trees, Problem Solving Templates, QFD/Pugh/FMEA Templates, and much more.
-
View Complete Statistical Tools Feature List
Control Charts
- Control Charts Wizard
- XbarR, XbarS, IMR, ZMR
- p Chart, np Chart, c Chart, u Chart
- G-Chart, T-Chart (Rare Events)
- Add/Remove Outliers
Analysis Tools
- Capability Analysis (Single & Multi)
- Capability Scorecard
- Histogram, Pareto, Bar Chart, Pie Chart
- Boxplot, Dot Plot, Scatter Plot
- Run Chart, Summary Stats
- Johnson Transformation
- Confidence Intervals (Normal, Std Dev, Binomial, Poisson)
- Correlation (Pearson, Spearman) & Covariance
- Time Series (Trend, Moving Avg, SEWMA, DEWMA, Cross/Auto/Partial Autocorrelation)
Hypothesis Tests
- Advisor Wizard & AutoTest
- F-test, Levene's, Bartlett's (Variation)
- 1-Sample, 2-Sample, Paired t-test
- One-way & Two-way ANOVA (Crossed & Nested)
- 1-Sample Sign, Wilcoxon, Friedman, Mood's Median, Kruskal-Wallis, Mann-Whitney
- One/Two Proportion, Chi-Squared Contingency
- One/Two Sample Poisson Rate
- Power & Sample Size for all major tests
- Normality Test
MSA (Gage R&R)
- Create MSA Template
- Type 1 Gage Study (Repeatability)
- ANOVA & Nested ANOVA (Standard & Extended)
- XbarR (Standard & Extended)
- Attribute MSA (Crosstab & Analytic)
Distribution Fit & Calculator
- Auto-Fit
- Normal, Exponential, Logistic, LogLogistic, LogNormal, Weibull, Gumbel, Johnson (2 & 3 param)
- Continuous: Normal, Uniform, Exponential, Gamma, Logistic, LogLogistic, LogNormal, Weibull, Beta, Laplace, Triangular, Cauchy, Rayleigh, Gumbel
- Discrete: Bernoulli, Binomial, Negative Binomial, Geometric, Hypergeometric, Uniform Discrete, Poisson
Reliability
- Censored & Uncensored Analysis
- Auto-Fit
- Exponential, Weibull, Normal, Logistic, LogLogistic, LogNormal, Gumbel, Johnson (2 & 3 param)
QFD, Pugh & FMEA
- Pairwise Comparison Matrix
- House of Quality (HOQ) with Wizard
- Pugh Matrix with Charts
- FMEA with Top 20 & Custom Pareto
Additional Tools
- Decision Trees
- Design Structure Matrix (DSM)
- Component Swapping
- Fishbone Diagrams
- Multi-Vari Charts
- Stack/Unstack Data
- Random Number Generation
- Data Templates
Design of Experiments (DOE)

- Design Wizards to help you select the best design for the problem
- Support for Full/Fractional Factorial, Central Composite, Box-Behnken, Plackett-Burman, Custom, and D-Optimal Designs
- Least Squares and Logistic Regression Analysis
- Automatic support for categorical predictor variables
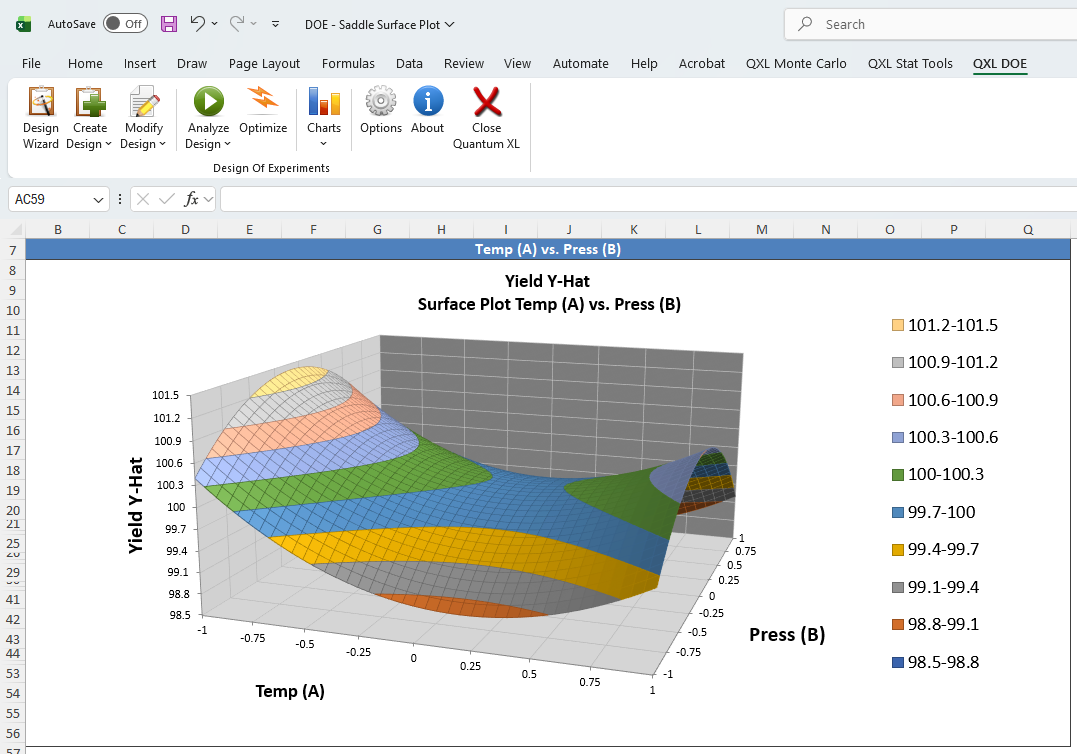
- Optimization, Surface, and Interaction Plots
-
View Complete DOE Feature List
Create Design
- Design Wizard
- Modeling: 2-Level, 3-Level, N-Level Factorial, CCD, Box-Behnken
- Screening: Plackett-Burman, Taguchi
- Special: Historical Analysis, Custom Design, D-Optimal
- Import from DOE Pro XL
Modify Design
- Input Name, Low/High, and Type
- Add/Remove Interactions
- Change Coding (Autocode/Standardize)
- Add/Remove Center Points
- Modify Axial Value (CCD)
- Change Blocking/Folding
- Add/Remove Runs
- Add/Remove Outputs & Replicates
- Convert Replicate Format (Table/Stacked)
- Randomize Run Order
Analyze & Optimize
- Run Regression
- Uncoded Coefficients
- Multi-Response Optimization
Charts & Diagnostics
- Pareto Regression Coefficients
- Interaction Plots
- Main Effects Plot
- Thumbnail Plot
- Surface and Contour Plot
- Residual Plots
Monte Carlo Simulation

- Insanely fast Monte Carlo Simulations: in excess of one million simulations per second for simple models
- Mersenne Twister Random Number Generation
- Support for most continuous and discrete distributions, as well as defining a custom distribution from data
- Latitude, Surface, and Contour Plots
- True Multi-Objective stochastic optimization and Percent Contribution plots
-
View Complete Monte Carlo Feature List
Design
- I/O Manager (Mark Input/Output/Unmark)
- Custom Distributions
- Create Empirical Distribution
- Create/Modify Design Sheet
- Merge & Visual Merge Design Sheets
- Convert to Visual
- Import Model from QXL DOE or DOE Pro
- Validate Model
- Clean up Workbook(s)
Run Simulation
- 1,000 / 10,000 / 100,000 / 1,000,000 Simulations
- N Simulations (custom count)
- Set up Histogram Groups
- Multi-Response Optimization
Contribution Tools
- Percent Contribution (1K–1M sims)
- Latitude Plot
- Surface and Contour Plot
- Tolerance Allocation (1K–1M sims)
- Sensitivity Analysis (1K–1M sims)
Additional Tools
- Latin Hypercube Sampling (LHS)
- Descriptive Sampling
- NOLHS Design
- Scorecard (New, Pareto All, Pareto Rollup)
- Linear Tolerancing (Simple & Advanced, 20–1000 parts)
Case Study
Machine Learning Inference Tuning using Quantum XL Version 18
by Raymond Balisonomo.
Case Study
Utilizing Quantum XL for Product Design with Multifactorial Parameters
by Ramon Balisnomo.