SPC XL
Your data is in Excel.
Why isn't your analysis?
Control Charts, Hypothesis Testing, Capability Analysis, and MSA, all in one Excel Add-In. The fastest way to go from raw data to actionable insight.
Free trial available. No credit card required.
The Core of SPC XL
Everything a Six Sigma practitioner needs to monitor, analyze, and improve processes without leaving Excel.
Control Charts
XbarR, Xbar S, Individuals Moving Range, p, np, u, and n charts. Includes a Control Chart Wizard, Cpk/Ppk analysis, and outlier marking, all updating in place without recreating charts.
Hypothesis Testing
t-Test, Paired t-Test, F-Test, 1-Way ANOVA, Test of Proportions, Independence Test, Confidence Intervals, and Sample Size calculations. Everything you need to make data-driven decisions.
Capability & MSA
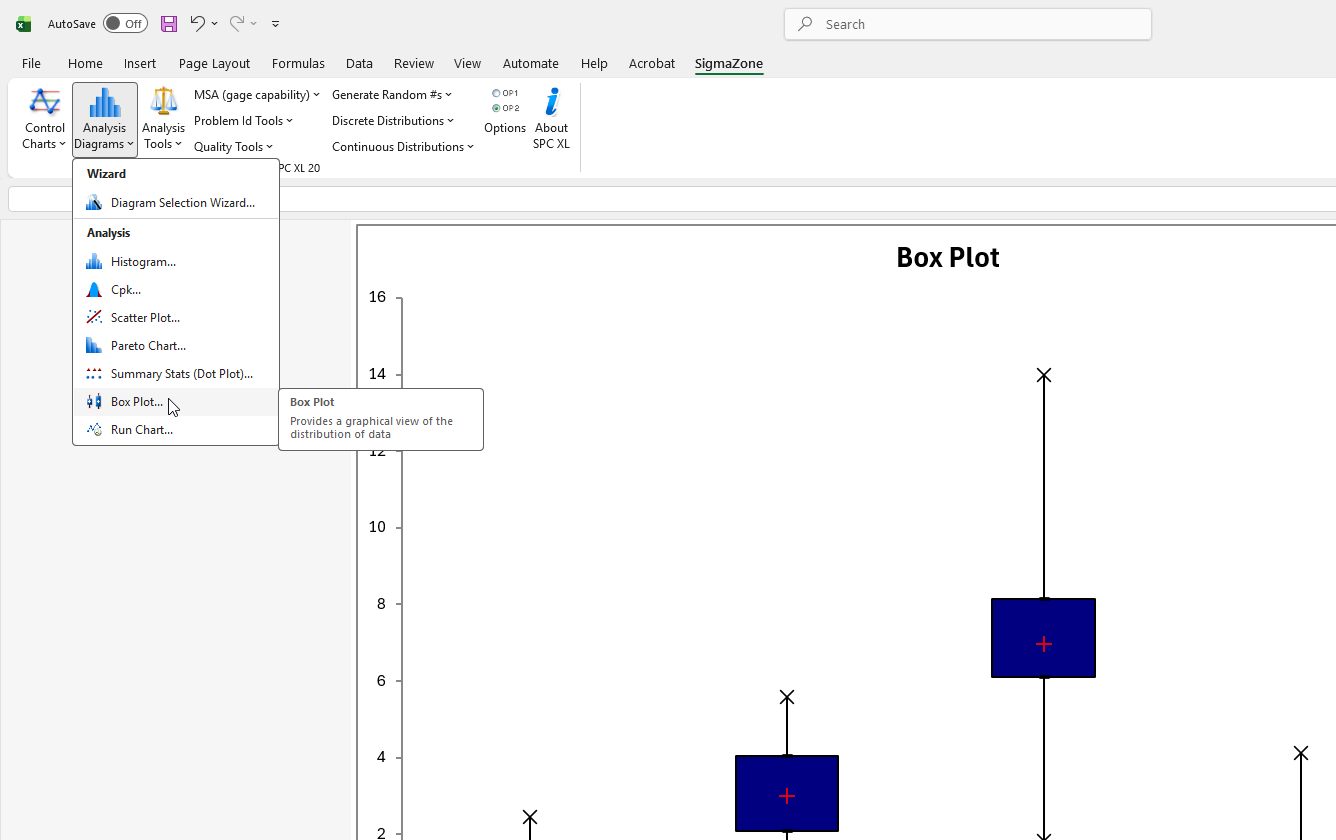
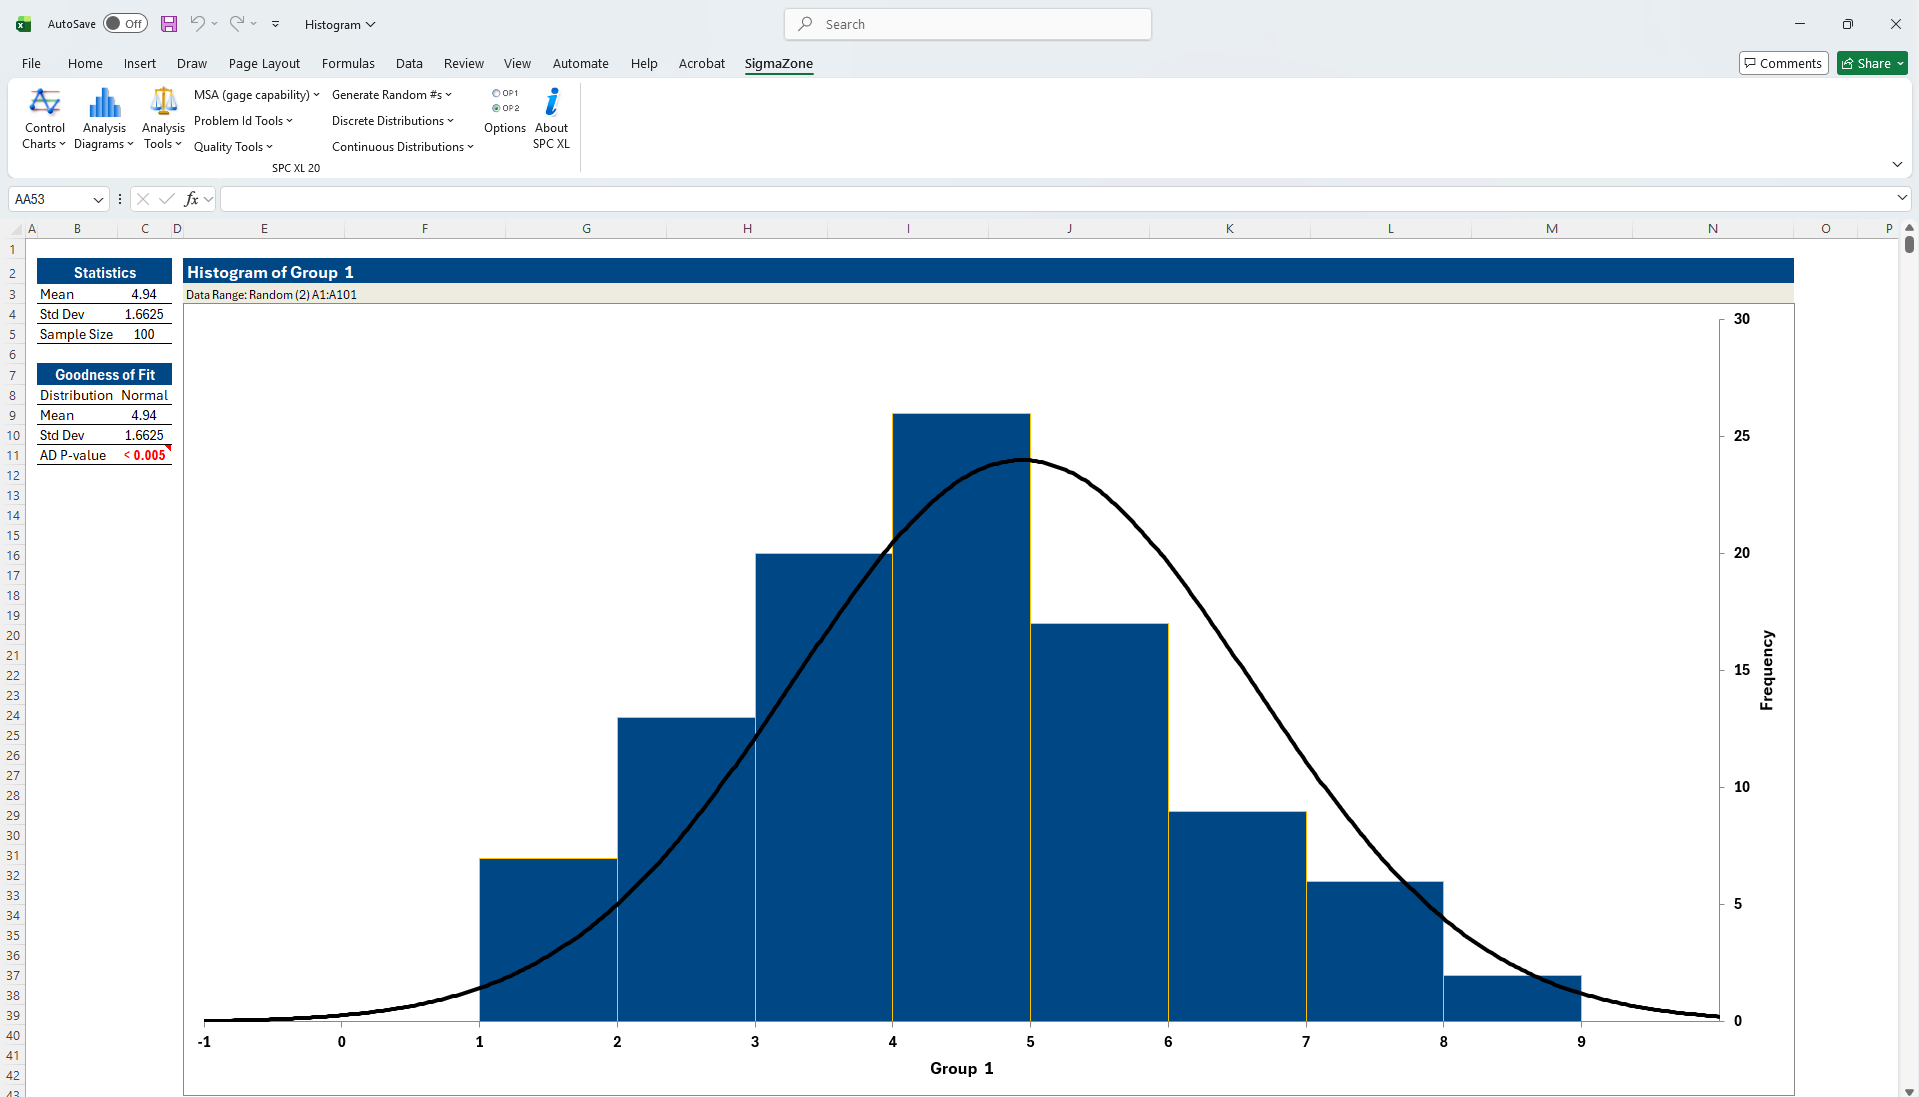
Capability Analysis Diagrams (Cpk), Histograms, Scatter Plots, Pareto Charts, Box Plots, and full Measurement System Analysis including Gage R&R (ANOVA and XbarR methods), and Attribute MSA.
 Excel Integration
Analyze Where Your Data Lives.
SPC XL installs directly into Excel and adds a dedicated ribbon tab. No switching applications, no exporting, no copy-paste errors. Your data stays in your spreadsheet, and so do your results.
-
 Instant results in your workbook
Charts and tables output directly into Excel, fully formatted and ready to paste into any report or presentation.
Instant results in your workbook
Charts and tables output directly into Excel, fully formatted and ready to paste into any report or presentation. -
 Wizards guide every step
The Control Chart Wizard and Diagram Selection Wizard help you pick the right tool for your data, even if you're not a statistics expert.
Wizards guide every step
The Control Chart Wizard and Diagram Selection Wizard help you pick the right tool for your data, even if you're not a statistics expert. -
 Update without recreating
Add new data to an existing control chart and update it in place. No need to start over: SPC XL preserves your control limits and formatting.
Update without recreating
Add new data to an existing control chart and update it in place. No need to start over: SPC XL preserves your control limits and formatting.