Statistics

Statistical Articles

Quantum XL Latitude Plot Part A vs Part B

Understanding Latitude Plots – Part I

Quantum XL‘s Latitude Plots are a visual depiction of the relationship between the expected variation and the latitude window. If used properly, Latitude Plots are an exceptional communication technique, but can be confusing to the uninitiated. This article introduces Latitude Plots and explains how to read them. To serve as an example, we will use […]

Understanding Latitude Plots – Part I Read More »

Wegmans Grocery Store

Using the Paired t-Test to compare Wegmans and Publix Supermarkets

Introduction Waiting for Tilapia. Waiting for Tilapia could be the title of a new indie film about the perils of climate change. But no, I was literally waiting for fish. I found myself staring aimlessly at the Tilapia in my local Publix(R) supermarket. The fresh fish is located behind a glass shield which requires a Publix

Using the Paired t-Test to compare Wegmans and Publix Supermarkets Read More »

Quantum XL AutoTest

Quantum XL’s Auto-Hypothesis Test

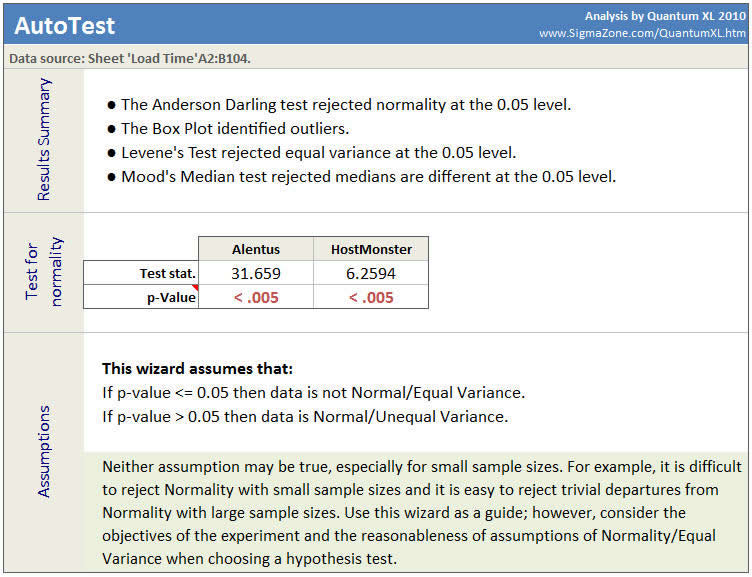
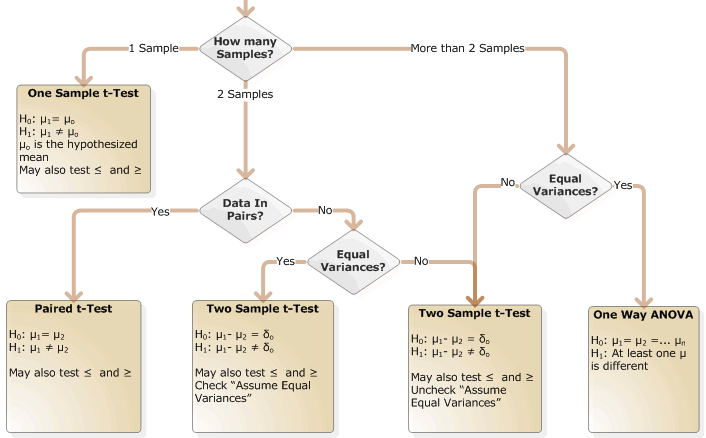
With the release of Quantum XL 2012, we introduced a Hypothesis AutoTest capability. This feature analyzes various statistics of your dataset and endeavors to perform the appropriate hypothesis test for Mean/Median and Variation. When analyzing two or more samples, AutoTest implements our flow chart for choosing the hypothesis test. While no automatic test is perfect, using

Quantum XL’s Auto-Hypothesis Test Read More »

Quantum XL Hypothesis Test Mean Flow

Beyond the t-Test and F-Test – Selecting the Correct Hypothesis Test

Most practitioners who use hypothesis test use the t-Test and F-Test to determine differences in mean and variation respectively. If you are new to hypothesis testing, try the introductory article on the alleged use of performance enhancing drugs by Roger Clemens and Barry Bonds. Not all datasets are appropriate for the t/F Test. To illustrate this,

Beyond the t-Test and F-Test – Selecting the Correct Hypothesis Test Read More »