Philip Mayfield

Quantum XL Stack Histogram

Optimization (Robust Design) using Quantum XL

Quantum XL’s optimizer provides the unique ability to minimize the defects per million (dpm) across multiple outputs in a model. The optimization is a true stochastic optimization, which means that the inputs are all modeled with probability distributions. This article explains how to use Quantum XL’s optimizer. This article builds on the concept of an […]

Optimization (Robust Design) using Quantum XL Read More »

Quantum XL Latitude Plot Part A vs Part B

Understanding Latitude Plots – Part I

Quantum XL‘s Latitude Plots are a visual depiction of the relationship between the expected variation and the latitude window. If used properly, Latitude Plots are an exceptional communication technique, but can be confusing to the uninitiated. This article introduces Latitude Plots and explains how to read them. To serve as an example, we will use

Understanding Latitude Plots – Part I Read More »

Kano's Model image C

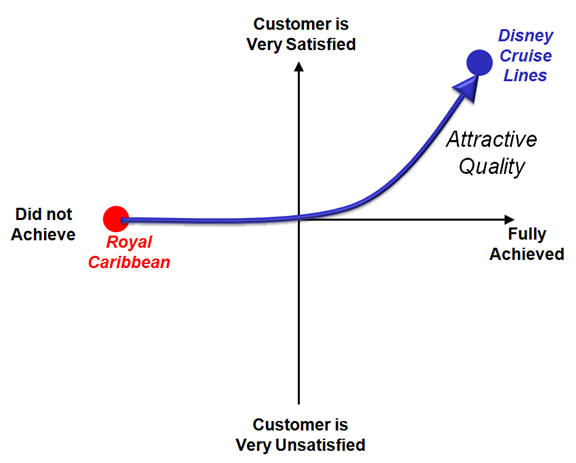
Kano’s Model Case Study Based on the Cruise Line Industry

Introduction Recently, I had the opportunity to take my family on a Royal Caribbean® cruise for our summer vacation. We had cruised in the past with Disney®, which led to an inevitable comparison of the quality of the two cruise lines. While on the Royal Caribbean cruise, I realized that the dichotomy between Disney and

Kano’s Model Case Study Based on the Cruise Line Industry Read More »

Wegmans Grocery Store

Using the Paired t-Test to compare Wegmans and Publix Supermarkets

Introduction Waiting for Tilapia. Waiting for Tilapia could be the title of a new indie film about the perils of climate change. But no, I was literally waiting for fish. I found myself staring aimlessly at the Tilapia in my local Publix(R) supermarket. The fresh fish is located behind a glass shield which requires a Publix

Using the Paired t-Test to compare Wegmans and Publix Supermarkets Read More »