

The Patriots were recently fined $1 million, lost two draft picks, and lost Tom Brady for four games. The NFL’s motivation was that the Patriots’ footballs were deflated to a pressure outside the acceptable range of 12.5 to 13.5 psi. Given the data that was recorded at halftime, a very good argument can be made that the Colts’ footballs were also outside of the acceptable range.
Measurement System Used by the NFL
For the full background on this dataset, I suggest you start by reading the previous article “Can The NFL Measure Footballs Precisely?“.
The Wells report tells us that the NFL measures the footballs before each game (page 7). At halftime, at the request of the Colts, 15 balls were measured again by two different officials using two different gages (page 7,8). The NFL requires the football pressure to fall between 12.5 and 13.5 psi.
The halftime measurements of 11 Patriots’ footballs and 4 Colts’ footballs are below. Each ball was measured by two referees; for example, the first Patriot football was measured at 11.5 psi by Referee #1 and then the same football was measured at 11.8 psi by Referee #2. In the Wells report, they indicate that only four Colts’ footballs were measured due to time constraints. I’ve color coded all measurements lower than the required 12.5 psi in red. All 22 measurements (11 footballs each measured twice) of the Patriots’ footballs were lower than the required 12.5 psi. However, 3 of the 8 measurements from Colts’ footballs were less than 12.5.

The obvious question at this point is “which referee, if either, is correct”? Based on the previous article, the Measurement System Analysis (MSA) shows that the measurement system is inadequate to effectively determine if a football is between 12.5 and 13.5 psi. However, the NFL is evidently unaware of, or ignoring the fact that their measurement system isn’t adequate. Thus, if the NFL is penalizing the Patriots, what about the Colts?
Referee #1 and Colt Footballs
The data below is only for the 11 Patriot footballs. Note that I’ve added a calculated column which is the difference between the measurements from Ref #1 to Ref #2. I’ve calculated it as Ref #2 minus Ref #1. If Ref #2’s measurement is larger, then the difference is positive. If Ref #1’s measurement is greater, then the difference is negative. Since these are measurements of the same football, for an ideal measurement system the difference would be zero. This is unrealistic for any measurement system, but a tendency to be positive or negative can tell us a great deal about bias.

If the difference includes roughly the same number (and magnitude) positive and negative values, then the measurement system would not have bias. However, if one referee tends to measure higher than the other consistently, the measurement system has statistical bias. Take a good look at the differences; all 11 of them are positive. Not only are they positive, but they are amazingly consistent between .3 and .45. Graphically, the bias between Ref #1 and Ref #2 can be seen below in the parallel nature of the two lines. The two referees have a very consistent bias for 11 consecutive measurements.

This is a strong indication of statistical bias between operators. In the English language, bias brings with it the assumption of malicious intent; in statistics, it does not. There are numerous reasons why two referees could have bias without the assumption of intent. For example, they could hold the gage at different angles or at different depths, hold the ball with more or less pressure, etc. The mere existence of this bias does indicate that the measurement system is poor, but it isn’t evidence of wrong-doing on the part of the referees.
Analysis with the Colts’ Data
The data below includes both the Patriots’ and Colts’ footballs. The cells in yellow are the four differences in the measurements from Ref #2 to Ref #1 when the Colts’ footballs are measured. You’ll notice that after 11 consecutive positive differences, of the next four measurements, three are negative.
At this point, if I were a Patriots fan, I would be crying foul. Especially since Referee #2 measured the Colts’ footballs #1, #2, and #4 below 12.5. Had the tendency of Referee #1 to measure lower than Referee #2 continued, then the Colts would have had three balls measured below 12.5 by both referees.

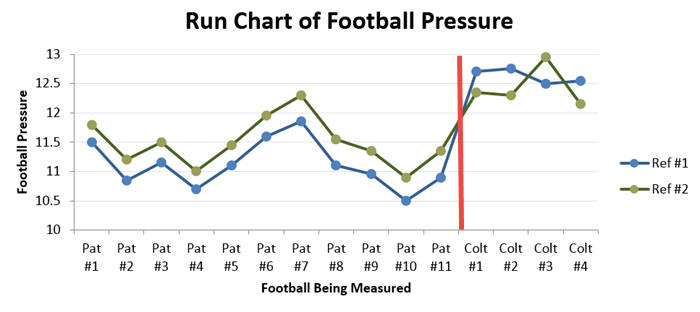
The change in bias is easy to see in the graph below. The red line indicates when the referees started measuring the Colts’ footballs. Note that Ref #1 is suddenly measuring higher than Ref #2.
Not only is that suspicious, but the only positive difference, Colt Football #3, occurs when referee #2 was greater than 12.5. I’ve shown this to Patriots’ fans who immediately decry foul play. To summarize their objections…
- Referee #1 was consistently lower than Referee #2 until he started measuring Colt footballs.
- When the measurement of Colt footballs began, Referee #2 shifted from measuring approximately .4 psi higher to .4 psi lower than Referee #1.
- Such a change could only be explained due to foul play.
From a statistical perspective, we can’t answer whether the referees were intentionally measuring the footballs differently. However, we can use a hypothesis test to determine if the change in measurements is likely due to random variation.
Hypothesis Test
Hypothesis testing is a statistical technique used to determine if two random samples taken from a population have different means (or medians). If you’re interested in a formal definition, read this article which uses hypothesis testing to determine if Barry Bonds’ and Roger Clemens’ performance improved during the period of alleged performance-enhancing drug use.
This particular dataset is small, making hypothesis testing challenging. With fewer data points, the ability to detect a statistically significant shift in the mean or median is difficult. Probably the most well known of all hypothesis tests is the t-Test. The t-Test returns a p-value; the interpretation of the p-value is (1-pvalue)*100% is the percent confidence that the average difference between referees changed when they measured the Colts’ footballs. The t-Test for this dataset returns a p-value equal to .0005. This can be interpreted as “we are 99.95% confident that the difference between referees changed from Patriots to Colts footballs”.
The problem with any hypothesis test is that it comes with assumptions. If the assumptions are violated, the resulting p-value could be incorrect. In an attempt to remove as many assumptions as possible, I’ve performed four different two-sample hypothesis tests using Quantum XL and included their assumptions in the table below.
Note that the results vary from 91.44% confidence to 99.95% confidence that the difference between referees changed from Patriots to Colts footballs.
Test | Result | Notes |
| t-Test (Equal Variance) | 99.95% | Assumes Normality and Equal Variance |
| t-Test (Unequal Variance) | 92.22% | Assumes Normality but not Equal Variance |
| Kruskal-Wallis | 92.57% | Test of Medians: Assumes similar shape and no outliers. |
| Mann-Whitney | 91.44% | Test of Medians: Assumes similar shape and equal variance. |
The obvious question at this point is “how much confidence is required”? That is a personal decision which varies based upon what you’re trying to prove. If you’re trying to prove someone committed murder, then you need to be more than 99% confident. However, in this case, I would take a much lower level of confidence. If I’m the NFL, I would expect my referees to measure the balls the same regardless of team. If I were even 80% confident that they weren’t treating the teams the same, it would cast doubt on those measurements.
Wells Report
On page 8 of the Wells report, the actions taken by the referees after testing the balls is included below.
“Before halftime ended, all eleven Patriots balls were inflated and set to a permissible pressure level. The four Colts balls tested were not inflated because they measured within the permissible range on at least one of the gauges used at
halftime. The fifteen footballs tested, and the balance of the Colts balls collected at halftime, were returned to the field for use in the second half.”
I’m surprised John Oliver hasn’t had a field day with this paragraph. Given two measurements, the referees chose the one that indicated that the footballs were properly inflated. They didn’t adjust the pressure, remove those footballs from play, or even re-measure them. They simply took the measurement that indicated the pressure was good and moved on.
Given measurements that indicated a team was violating the rules, it seems particularly odd that corrective action wasn’t taken by the referees. In fact, one could argue that of the two teams, the Colts were given an unfair advantage, as they were permitted to resume play with three footballs in which at least one referee measured low pressure.
Finally, what about the other Colt footballs? Four measurements were all very close to the lower limit. At the very least, continued inspection seems justified.
Conclusion
Key points thus far…
- Based on the data from the Wells Report, the NFL can’t reliably determine if a football is between 12.5 and 13.5 psi. See my first article for a full explanation.
- The referees allowed three footballs from the Colts organization to return to play despite one of the referees measuring the balls lower than the required 12.5 psi.
- Based on the results from the hypothesis test, it is very likely that the referees changed their bias when measuring Colts’ footballs vs. Patriots’ footballs.
I should note that there are other issues in the Wells report that are not based on quantitative data. The text messages, moving of footballs, etc., are all outside this analysis. However, at the core of the NFL’s argument is that the Patriots did use footballs with less than 12.5 psi.
Given the problems with the measurement system, I find it odd that the NFL would take punitive actions against the Patriots instead of fixing their own measurement systems. If they are going to fine the Patriots, then they should also fine the Colts, as their footballs also measured out of limits.
Notes for the Statistically Inclined
Given the emotional nature of the subject, there are likely going to be numerous objections to this article. Before leaving an inflammatory comment, please read the following notes.
The “pure” interpretation of the t-Test for a p-value would be, “If I conclude the means are different then I have a .05% chance of making a mistake”. For the purposes of the article and with the intent to make it easier to read for the layperson, I expressed that as “99.95% confidence there is a difference in means”.
Several people have asked about the percent confidence that there isn’t a difference in means. Using hypothesis testing, it isn’t valid to post the hypothesis in that manner.
All hypothesis tests were two-sided tests. Using a one-sided test would provide results in favor of the Patriots, but would not be valid, as I formed my hypothesis after looking at the data. Using a one-sided test would arbitrarily reduce the p-value in half, but only as a result of knowing in which direction the sample means were different for the Patriots vs. the Colts. If you’re a Patriots fan and inclined to duplicate my analysis, I encourage you to use the two-sided test to avoid bias.
Some might question the use of a Hypothesis Test since I didn’t formally propose my hypothesis before the data was collected. Unfortunately, we don’t have that option. However, I wasn’t involved in the data collection nor am I a Patriots fan. In the Wells report, their independent lab used “five individuals” to evaluate the effect of human to human variation. If the NFL is willing to use data made by different humans with different levels of training, then using the actual data from the actual referees doesn’t seem like much of a stretch.
Hypothesis testing requires random selection of samples from a population. For the purposes of this article, the population would be the footballs each team typically uses in a game. The samples aren’t random for two reasons. First, the samples were taken from one game. Second, and more significantly, the Colts requested that the footballs be retested. They should have therefore expected their footballs to be tested, also. Most people would make sure their footballs were inflated to the required pressure if they expected a measurement at halftime.
The Shapiro-Wilk test rejected normality (p=.019) for the Colts’ data. The Anderson Darling also rejected normality at p=.0274.
The F-Test rejected equal variance with p<.0001. Levene’s Test failed to reject normality at the p<.1 level (p=.11). The F-Test assumes normality, while Levene’s does not.
Determining normality and equal variance is difficult given the small sample size. Therefore, I ran multiple tests to determine if the results were consistent. I chose not to run Mood’s Median, as the Kruskal-Wallis is more powerful and the data didn’t show any indication of outliers.
There are potential reasons that might explain why the referees measured the footballs differently for the Colts, which do not include any intent to deceive. For example, perhaps they measured the two teams’ footballs using different gages, they swapped gages, changed their technique, etc. The hypothesis test can’t prove intent; it only indicates the likelihood that something changed.
I’m not a statistician. From the viewpoint of the chosen few within the enlightened realm of statistics, I am a benighted heathen.
Oh, I do freely admit that statistical analysis is an invaluable tool in quality improvement/assurance in a manufacturing environment (thank you, W. E. Deming). However, to reach high confidence levels using that type of analysis requires a large universe from which to draw clean samples, unskewed by multiple “dirty” variables. As the size and cleanliness of the universe diminishes, so does the level of confidence. In the various positions I filled throughout my life, I often saw statistics misused, and have come to view statistical analysis of small universes with a jaundiced eye.
I speak only from the outlook of a stranger to statistics…and can look only through my own eyes, as I said, the eyes of a skeptic. I believe there are way too many variables that could intrude into any analysis of your very limited data-set. Understand, I am not accusing you of inaccuracy, or bias, or misuse of data. I only am addressing the small number of data points, and the large number of potential variables.
However, looking at the graphed data, it is impossible to overlook the obvious…something changed. I can see two scenarios which, in my myopia, are almost equally probable: (a) one of the gauges was inaccurate, and for whatever reason, the two referees swapped gauges after measuring the Patriots’ balls; (b) Referee #1 REALLY disliked the Patriots, or Tom Brady, or both, and found some way to fudge the recorded measurements.
Like I said…views from a myopic, benighted heathen.