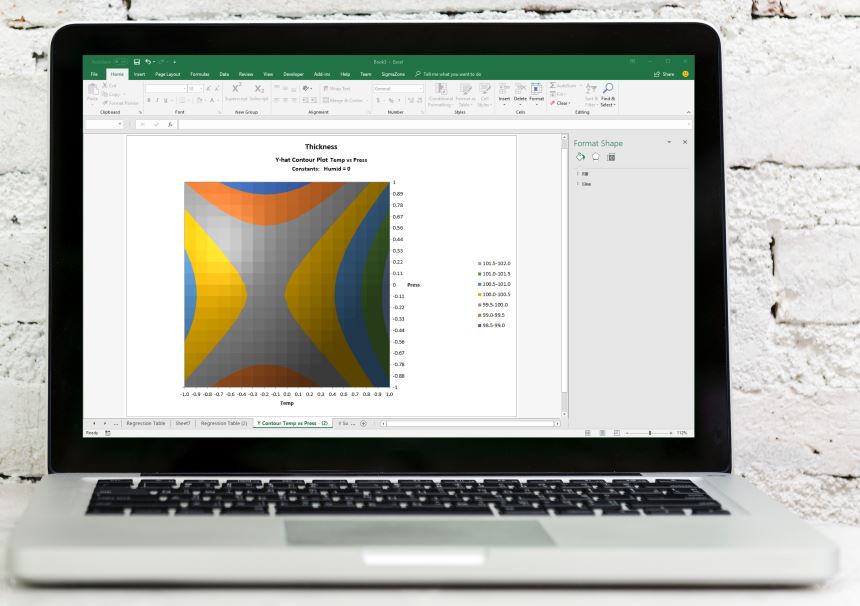
DOE Pro XL
DOE Pro XL adds Design Of Experiments functionality into Excel. Create designs, analyze using regression or ANOVA, predict, optimize, graph, and more.

DOE Pro XL Features

Expand the area below to see all of DOE Pro XL’s features.
DOE Pro XL integrates into Excel to speed up your data analysis workflow. Instead of copying and pasting your data into another application, with DOE Pro XL you can store, analyze, and present your results within Excel.
- 2 Level Designs
- Full Factorial
- Fractional Factorial
- Taguchi L4, L8, L12, L16, L32
- Plackett-Burman 8, 12, 16, 20, 24, 28
- 3 Level Designs
- Full Factorial
- Taguchi L9, L18, L27
- Central Composite Design
- Box – Behnken
- Custom Design
- Add/Remove Replicates
- Add/Remove Outputs
- Change Name, High, or Low Value
- Change Interactions
- Generate Random Responses
- Add Runs
- Randomization String
- Multiple Response Regression
- Simultaneous and automatic Y-Hat and S-Hat modeling
- Model more than one response in the same model
- Coded or Uncoded Coefficients
- ANOVA
- Multiple Plots
- Marginal Means (Main Effects) Plots
- View Aliasing Pattern
- Interaction Plot
- Surface Plot
- Contour Plot
- Pareto of Regression Coefficients
- Multiple Plots
- Main Effects (Marginal Means) Plots
- Multi-Response Optimization using our powerful Genetic Algorithm
- Optimize Y-Hat, S-Hat, or Cpk-Hat
- Define multiple constraints
- Each constraint can be assigned a weight based on goals
Available Residuals
- Leverage
- Residual
- Studentized Residual
- R-Studentized Residual
- Cook’s D
Plot Residuals Versus
- Factors
- Run #
- Actual Y
- Predicted Y
